Portland Metro Housing Market Update: Week of July 21, 2026
The Portland Metro housing market kept its summer rhythm this week, with buyer activity picking up even as sellers grow more willing to meet the market on price. Homes sold ticked higher, new pending sales jumped, and price reductions eased back from recent weeks. Rates moved up slightly, landing at the highest point of the current tracking window. Here is what the numbers are telling us, metric by metric.
Supply
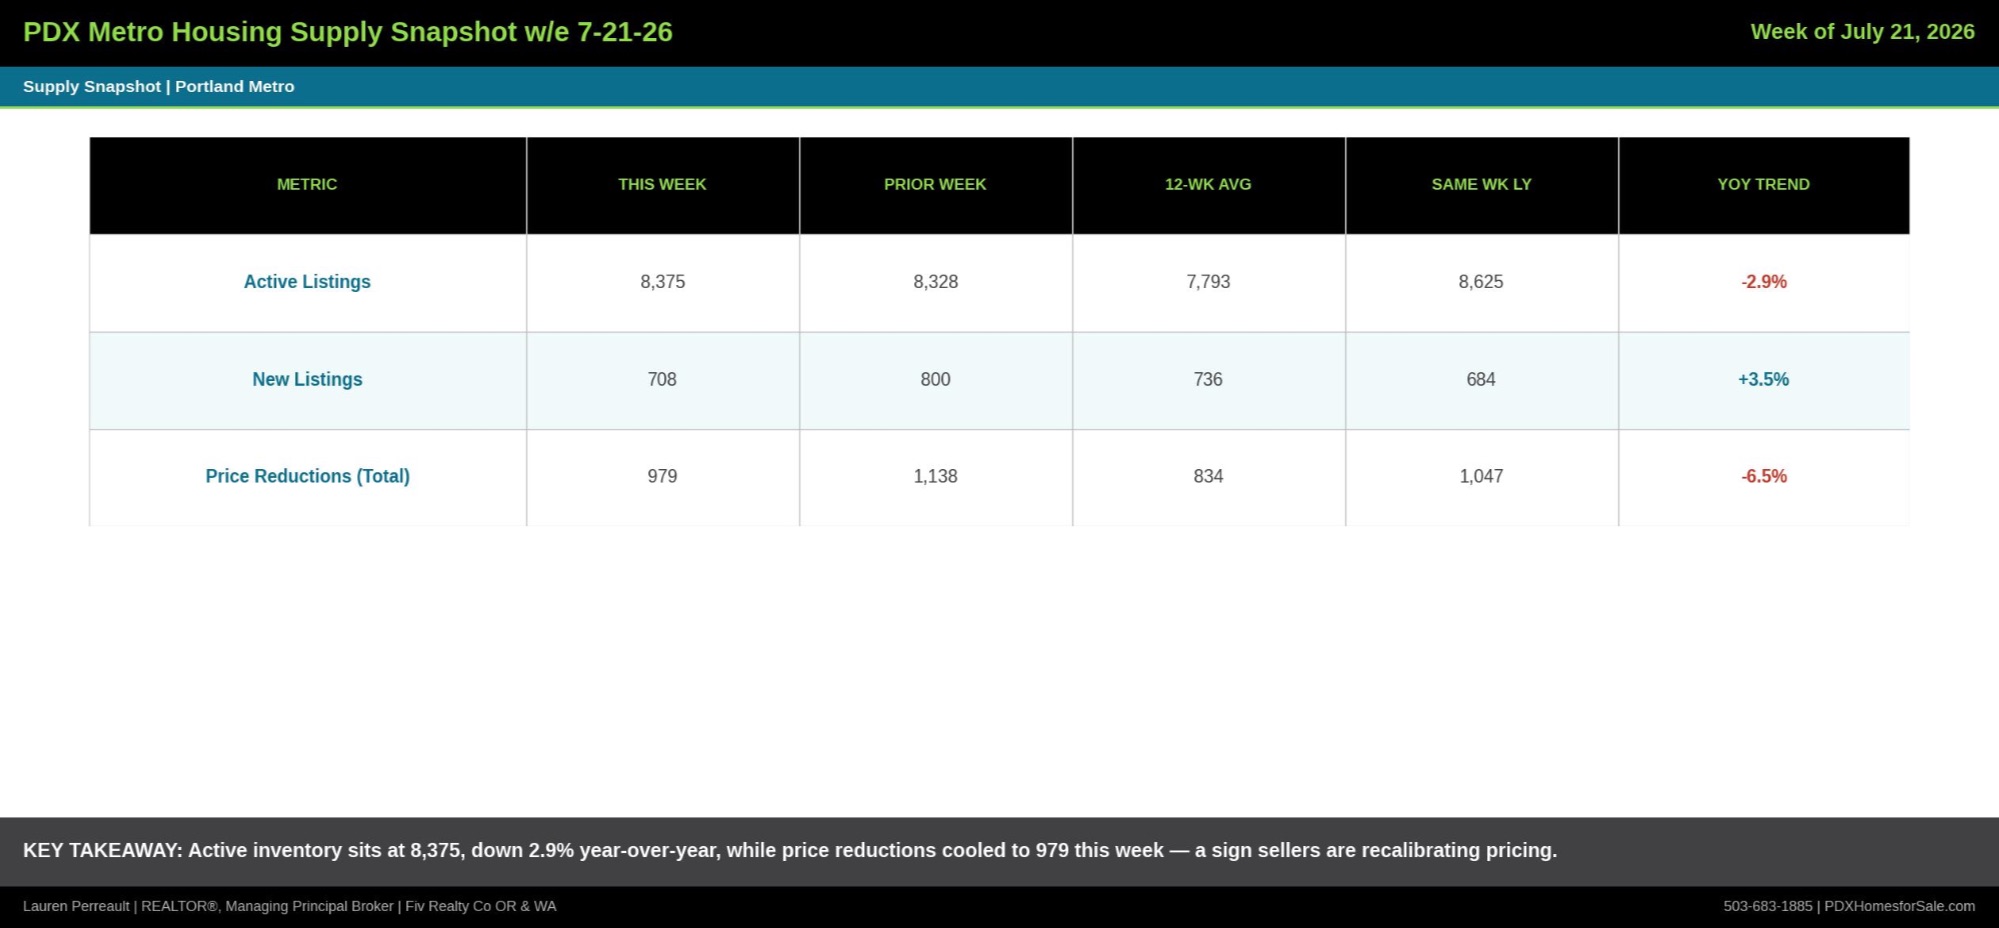
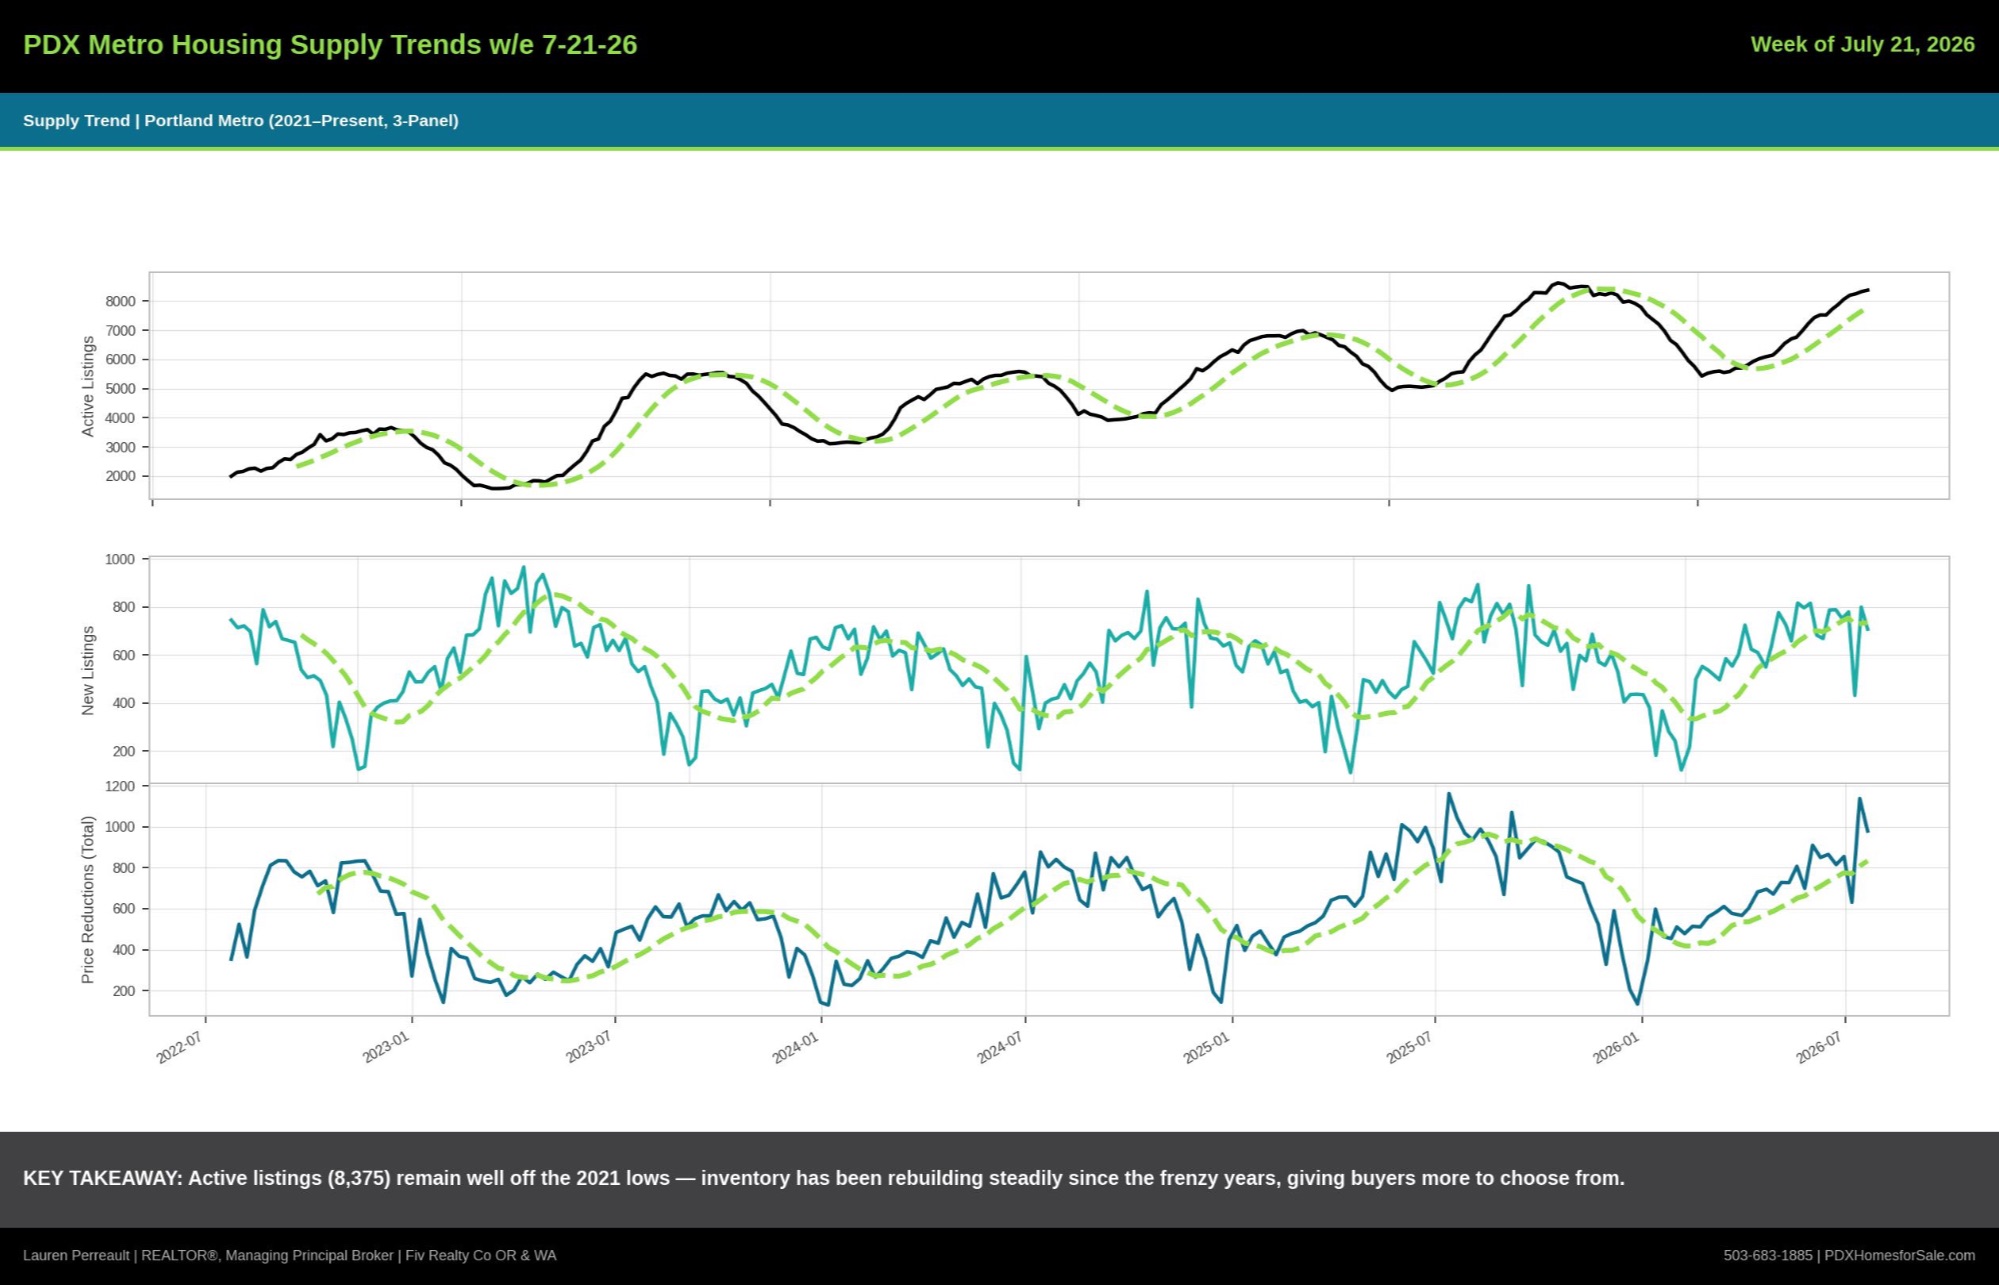
Active listings climbed to 8,375 this week, up from 8,328 the week before. That is a 2.9 percent decrease from the 8,625 homes on the market during the same week last year, which tells us inventory has tightened modestly on a year-over-year basis even though the raw number is still trending upward week to week. The 12-week rolling average now sits at 7,793 homes, compared to 7,901 during the same period last year, reinforcing that supply growth this summer has been a bit more restrained than it was in 2025.
New listings came in at 708, a pullback from 800 the prior week but still 3.5 percent ahead of the 684 new listings recorded during the same week last year. Sellers are continuing to test the market at a steady clip, and the 12-week average of 736 new listings per week shows that pace holding fairly consistent through the summer selling season.
Taken together, these two numbers describe a market where inventory is neither flooding nor drying up. That balance matters more than either number on its own. A market with too little new supply tends to push prices up faster than wages can keep pace, while a market flooded with new listings tends to soften pricing power for sellers. Right now, Portland Metro sits in a middle zone, with just enough new inventory arriving each week to give buyers real choices without overwhelming demand.
Demand
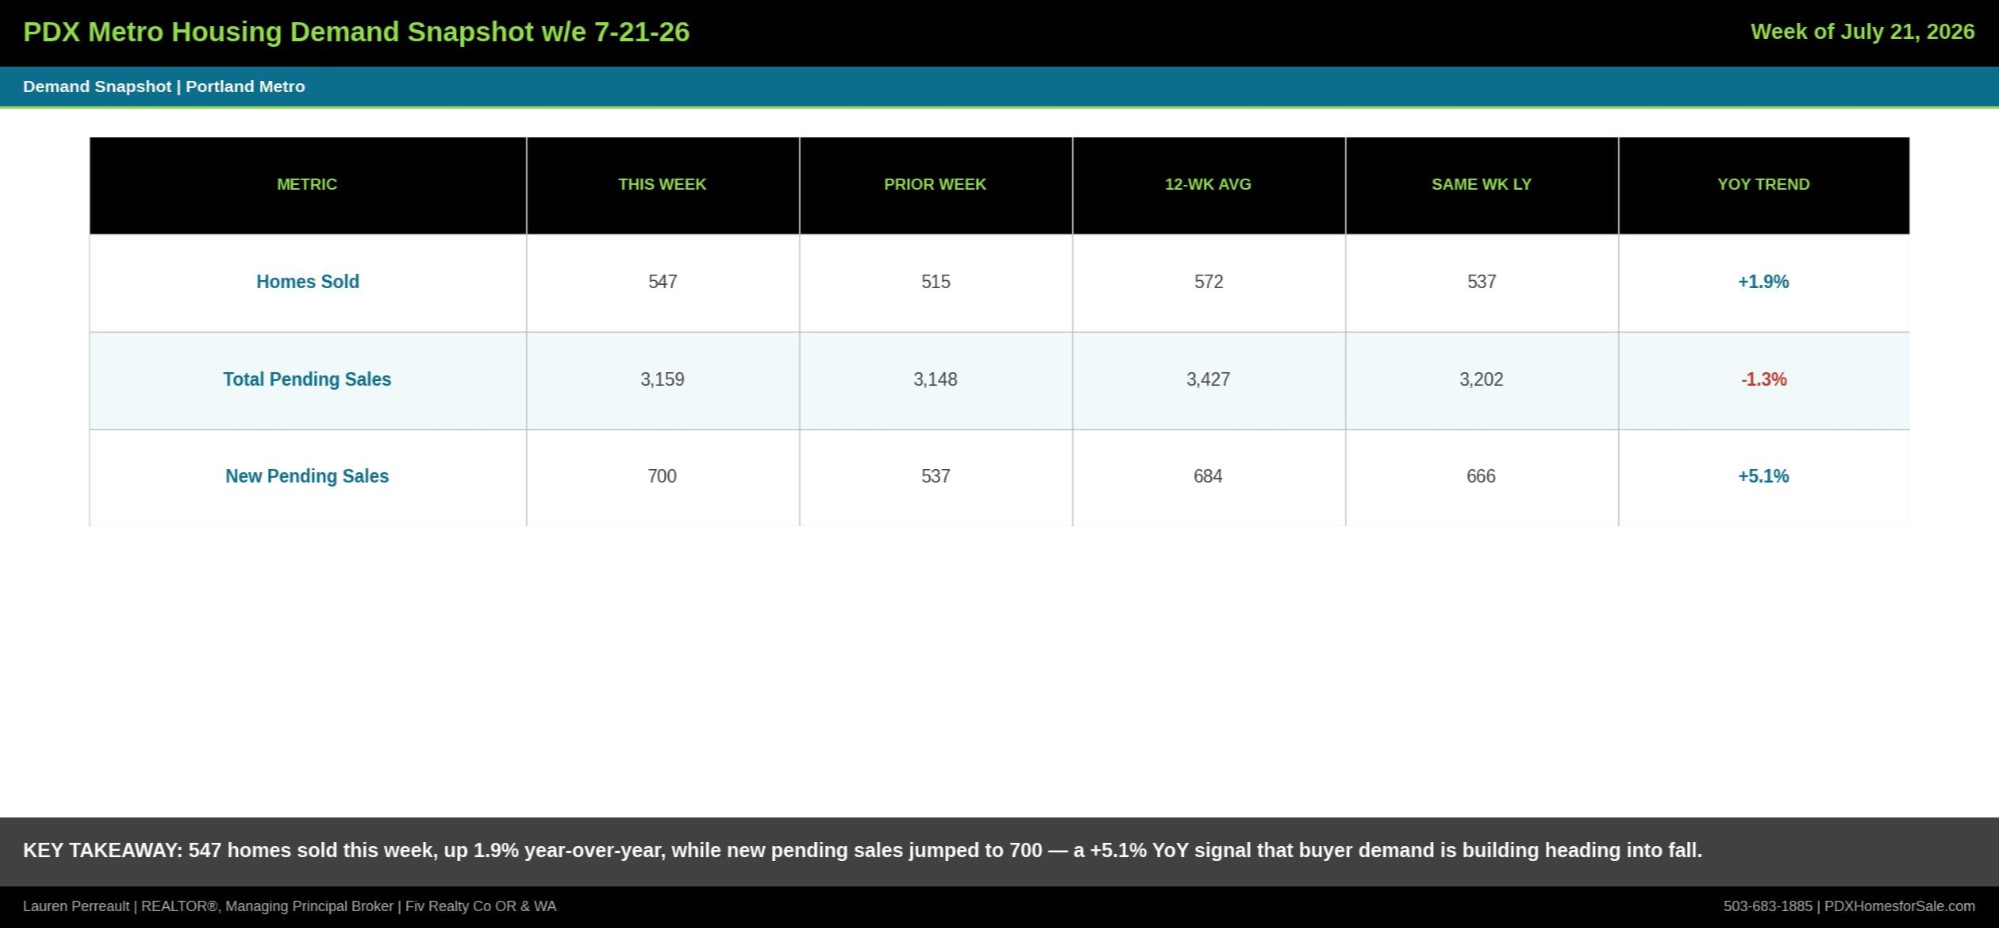
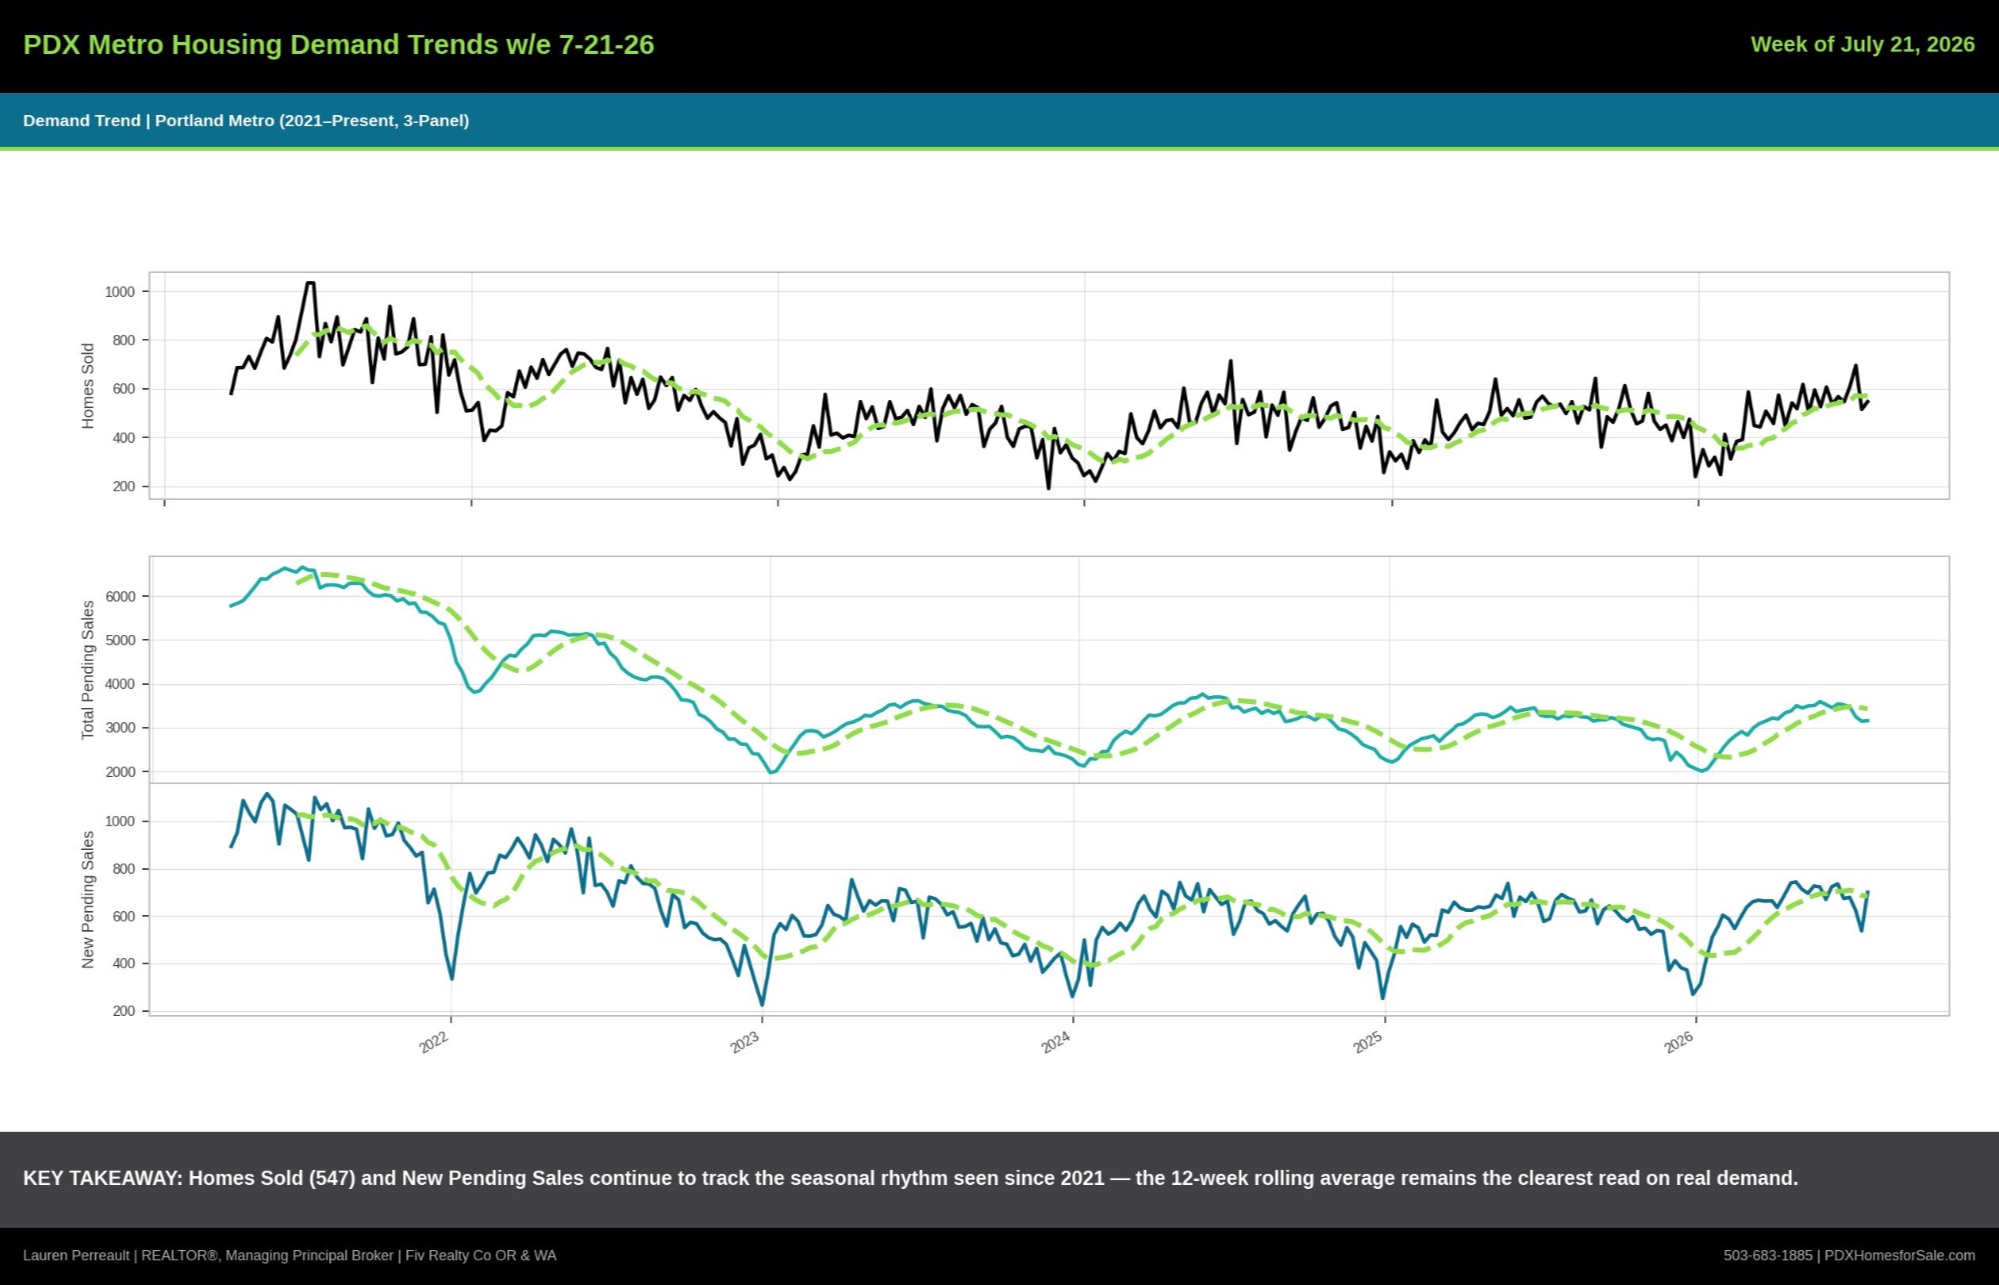
Homes sold reached 547 this week, up nicely from 515 the week before and 1.9 percent higher than the 537 homes sold during the same week last year. The 12-week rolling average for homes sold now stands at 572, well ahead of last year's 531 over the same stretch. That gap is meaningful. It suggests buyer activity has been consistently stronger this summer than it was a year ago, even with rates sitting where they are.
Total pending sales held close to flat at 3,159, up slightly from 3,148 the prior week. New pending sales, however, jumped to 700 from just 537 the week before, a 5.1 percent increase over the 666 new pending sales from the same week last year. That kind of week-over-week jump in new pending activity is often an early signal that a wave of newly listed inventory is finding buyers quickly, and it is worth watching whether that pace holds into August.
It helps to think of these three demand metrics as a pipeline. New pending sales show what is entering contract this week. Total pending sales show the overall backlog of deals working their way toward closing. Homes sold shows what actually made it across the finish line. When all three are moving in a positive direction at once, as they are this week, it tells us demand is not just holding steady but building. That is a notable shift heading into the back half of summer, a period that can sometimes see buyer fatigue set in after months of searching.
Pricing
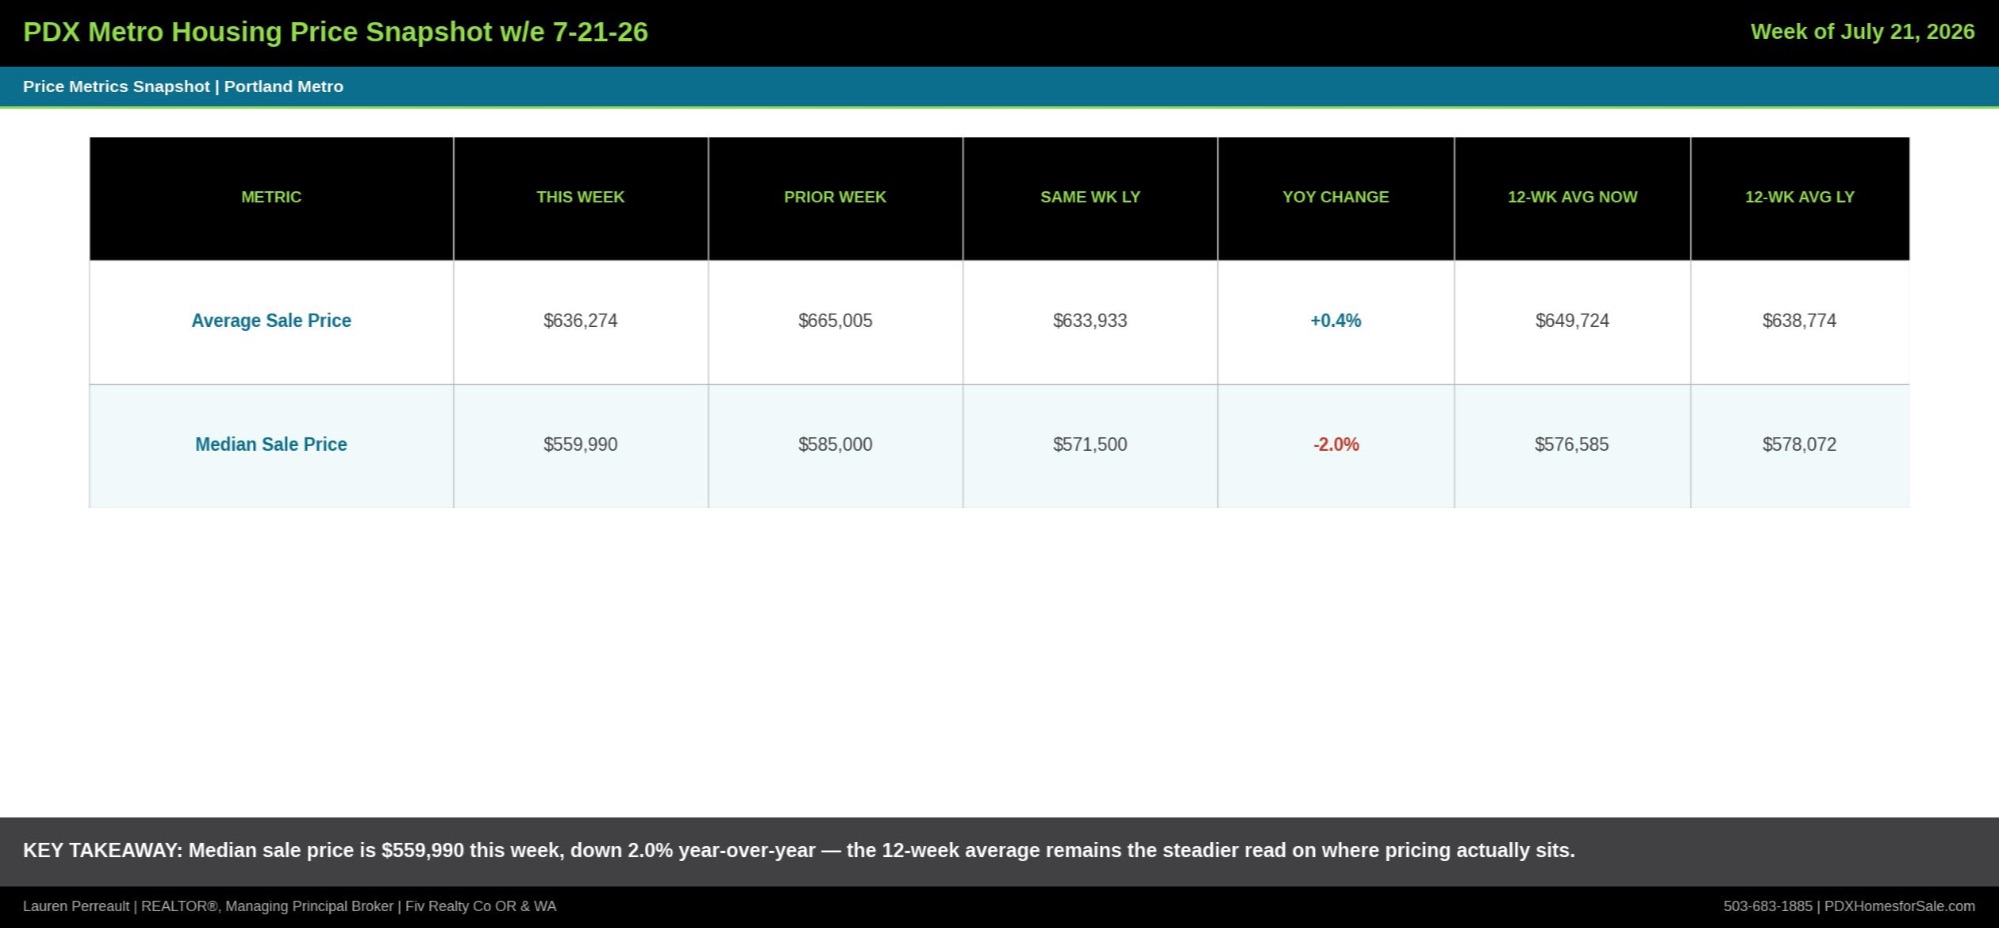
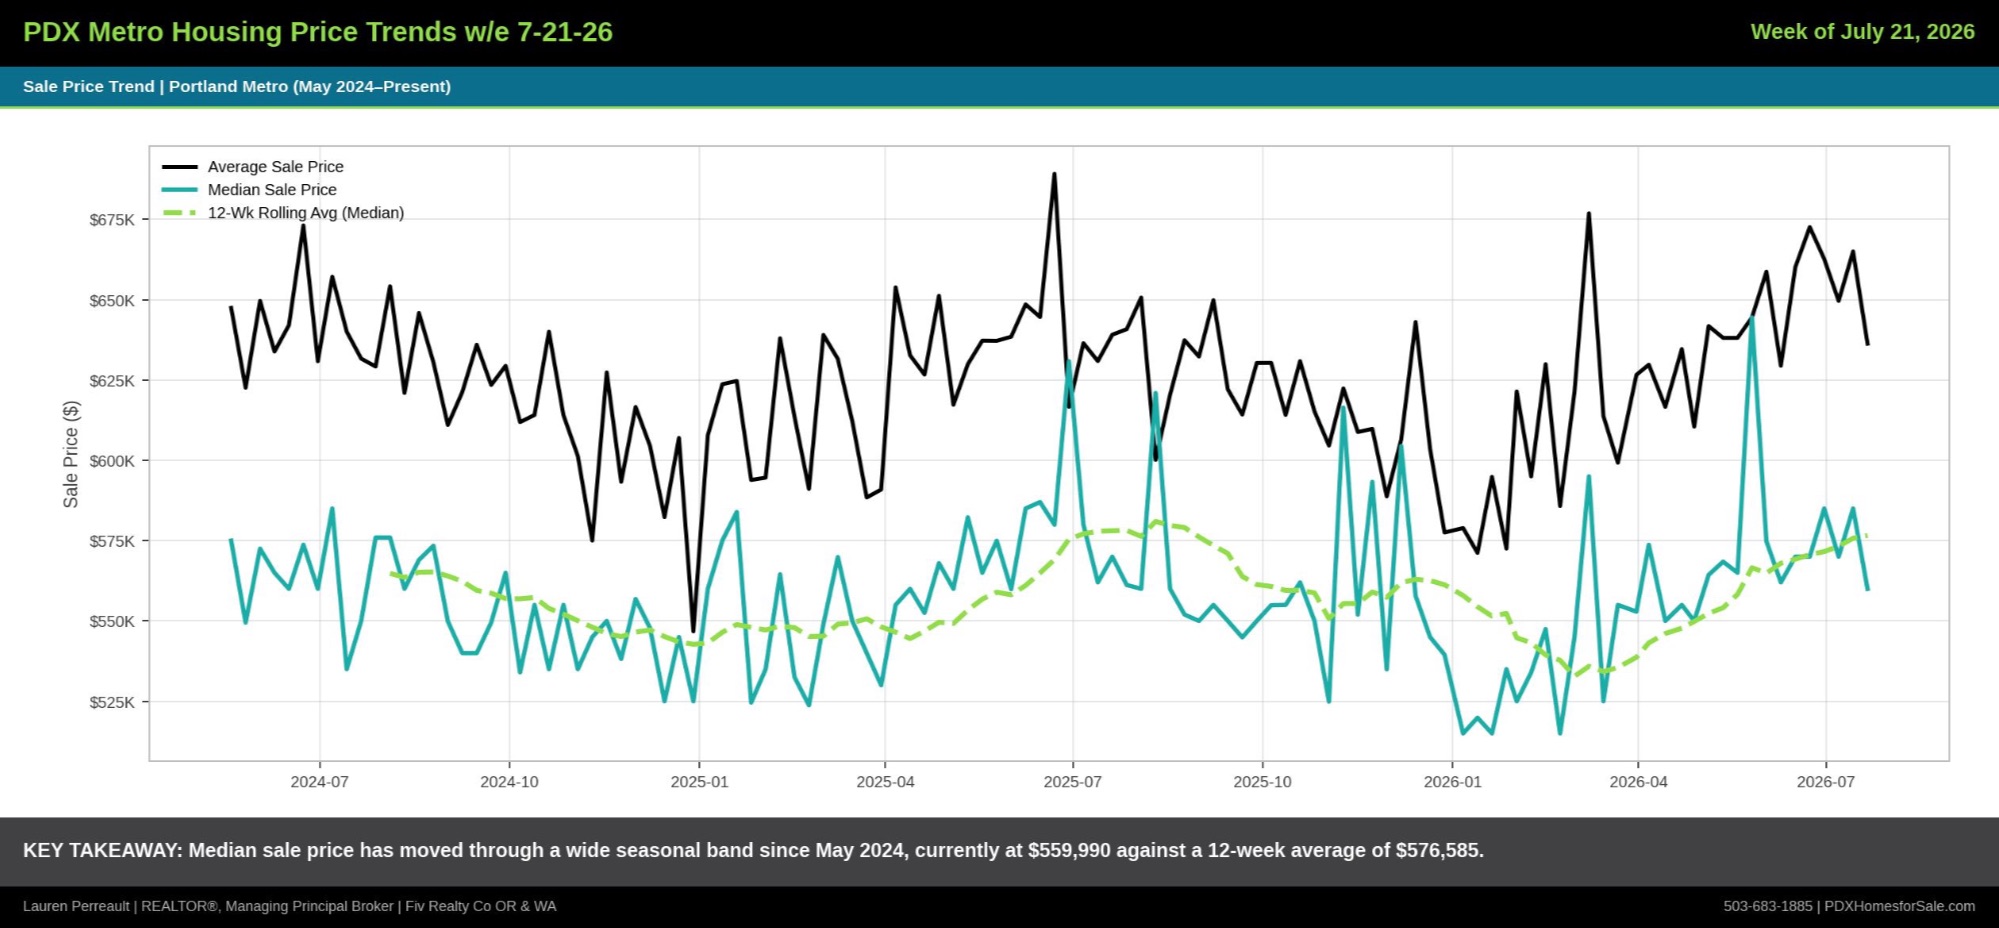
Average sale price landed at $636,274 this week, down from $665,005 the prior week but essentially flat year-over-year at 0.4 percent above the $633,933 average from the same week last year. Median sale price came in at $559,990, down from $585,000 the week before and 2.0 percent below the $571,500 median from a year ago.
Weekly swings like this are normal and often reflect which price bands closed escrow that particular week rather than a shift in the broader market. That is exactly why the 12-week rolling average matters more than any single week. On that basis, average sale price sits at $649,724 versus $638,774 during the same period last year, a gain of roughly 1.7 percent. Median sale price on a 12-week basis is essentially unchanged, at $576,585 compared to $578,072 last year. Read together, the rolling averages paint a market that is holding its value, even as individual weeks bounce around.
It is worth remembering why average and median tell slightly different stories. Average sale price can be skewed upward by a handful of higher-end closings in any given week, which is part of why this week's average came in well above the median. Median sale price is less sensitive to those outliers and tends to be the more reliable gauge of what a typical Portland Metro buyer is actually paying. When both measures point in a similar direction over a 12-week window, as they do here, it gives us more confidence that the underlying pricing environment is genuinely stable rather than being distorted by a few unusual transactions.
Price Reductions
Price reductions over the past seven days totaled 979, down from 1,138 the prior week and 6.5 percent below the 1,047 reductions recorded during the same week last year. Of those, 513 were reductions of $15,000 or more, continuing a trend of larger, more decisive price corrections rather than small incremental trims.
The 12-week rolling average for total price reductions now sits at 834, compared to 916 during the same period last year, an 8.9 percent decline. Fewer reductions relative to a year ago is a meaningful data point. It suggests more sellers are pricing accurately from the start this year, rather than listing high and cutting later.
Days on Market
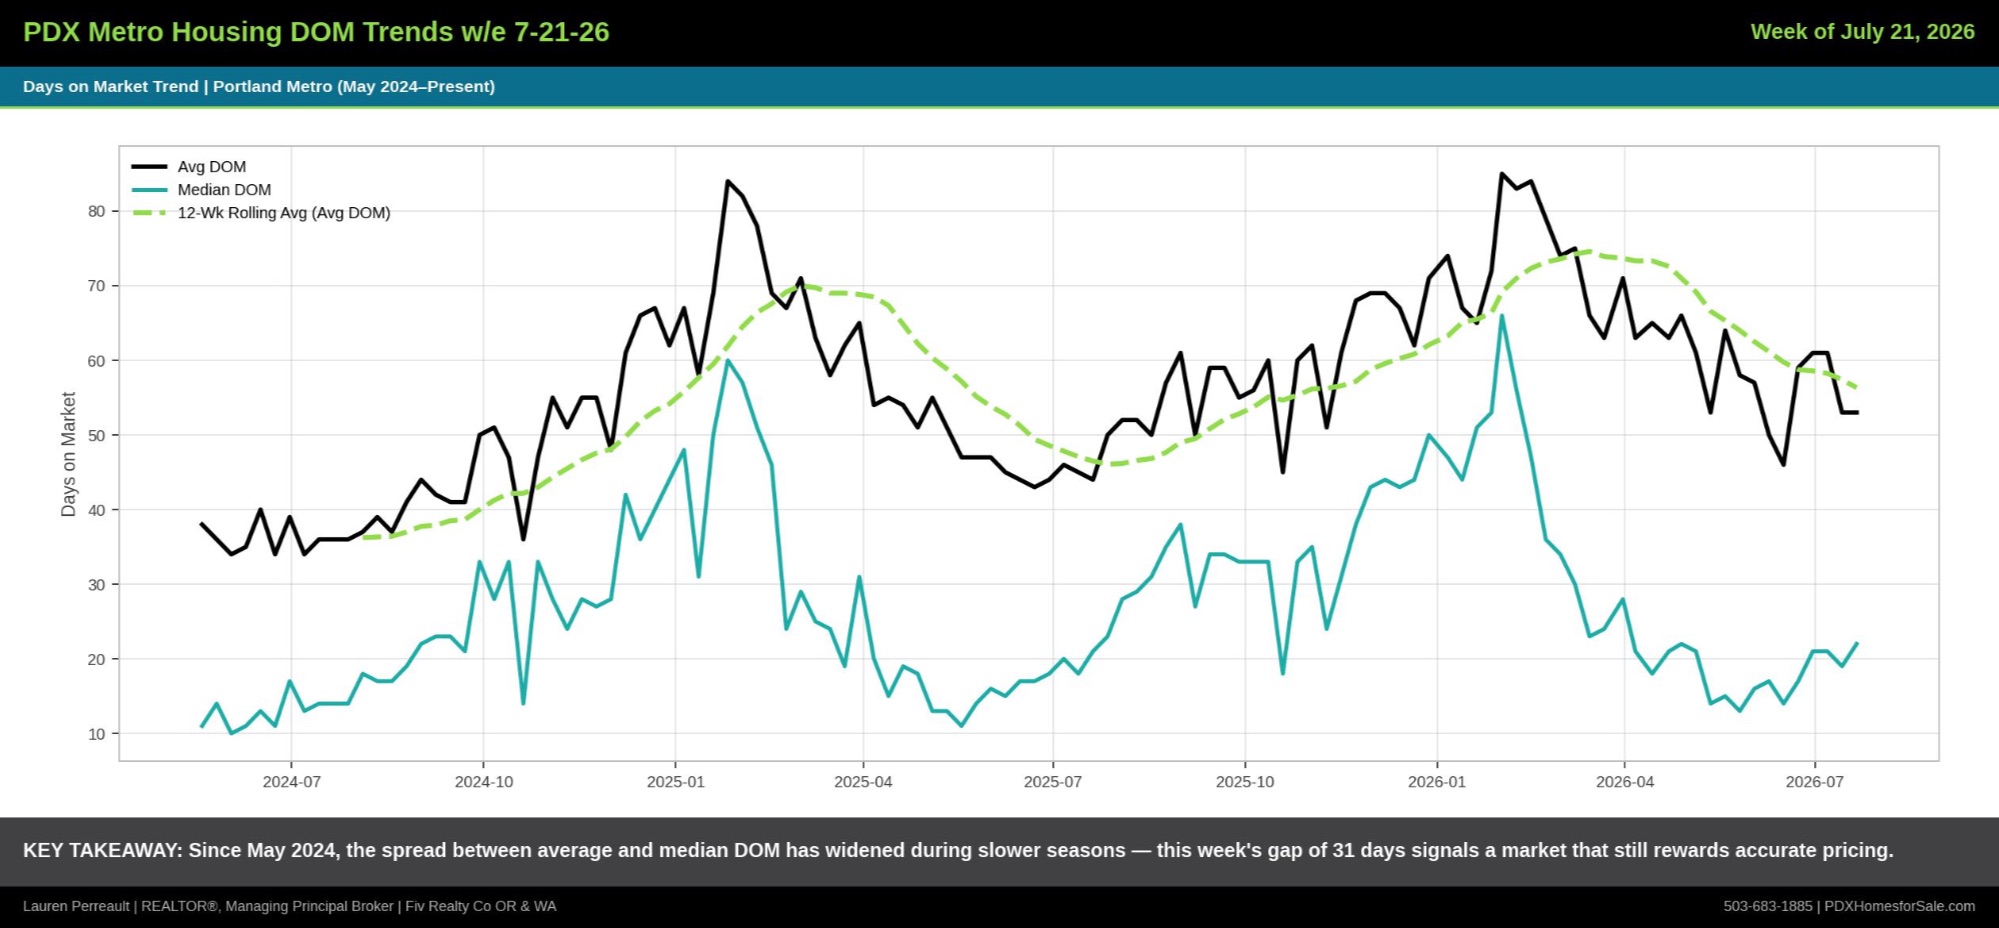
This week's Days on Market numbers illustrate a pattern we have been tracking closely: the two-speed market. Average DOM came in at 53 days, unchanged from the prior week and 10.4 percent higher than the 48 days recorded during the same week last year. Median DOM, meanwhile, held at 22 days, exactly matching last year's figure.
That 31-day gap between average and median DOM is the story here. Median DOM tells you how fast a well-priced, well-presented home moves. Average DOM gets pulled upward by the properties that linger, whether due to price, condition, or location. When the gap between those two numbers widens, it usually means the market is rewarding accurate pricing more than ever, while punishing homes that are priced ahead of where buyers are willing to go. On a 12-week rolling basis, average DOM sits at 56.3 days versus 46.5 days last year, while median DOM is up slightly to 17.5 days from 16.1. The overall market has slowed somewhat since last summer, but the homes priced right are still moving close to the same pace they always have.
Sale-to-List
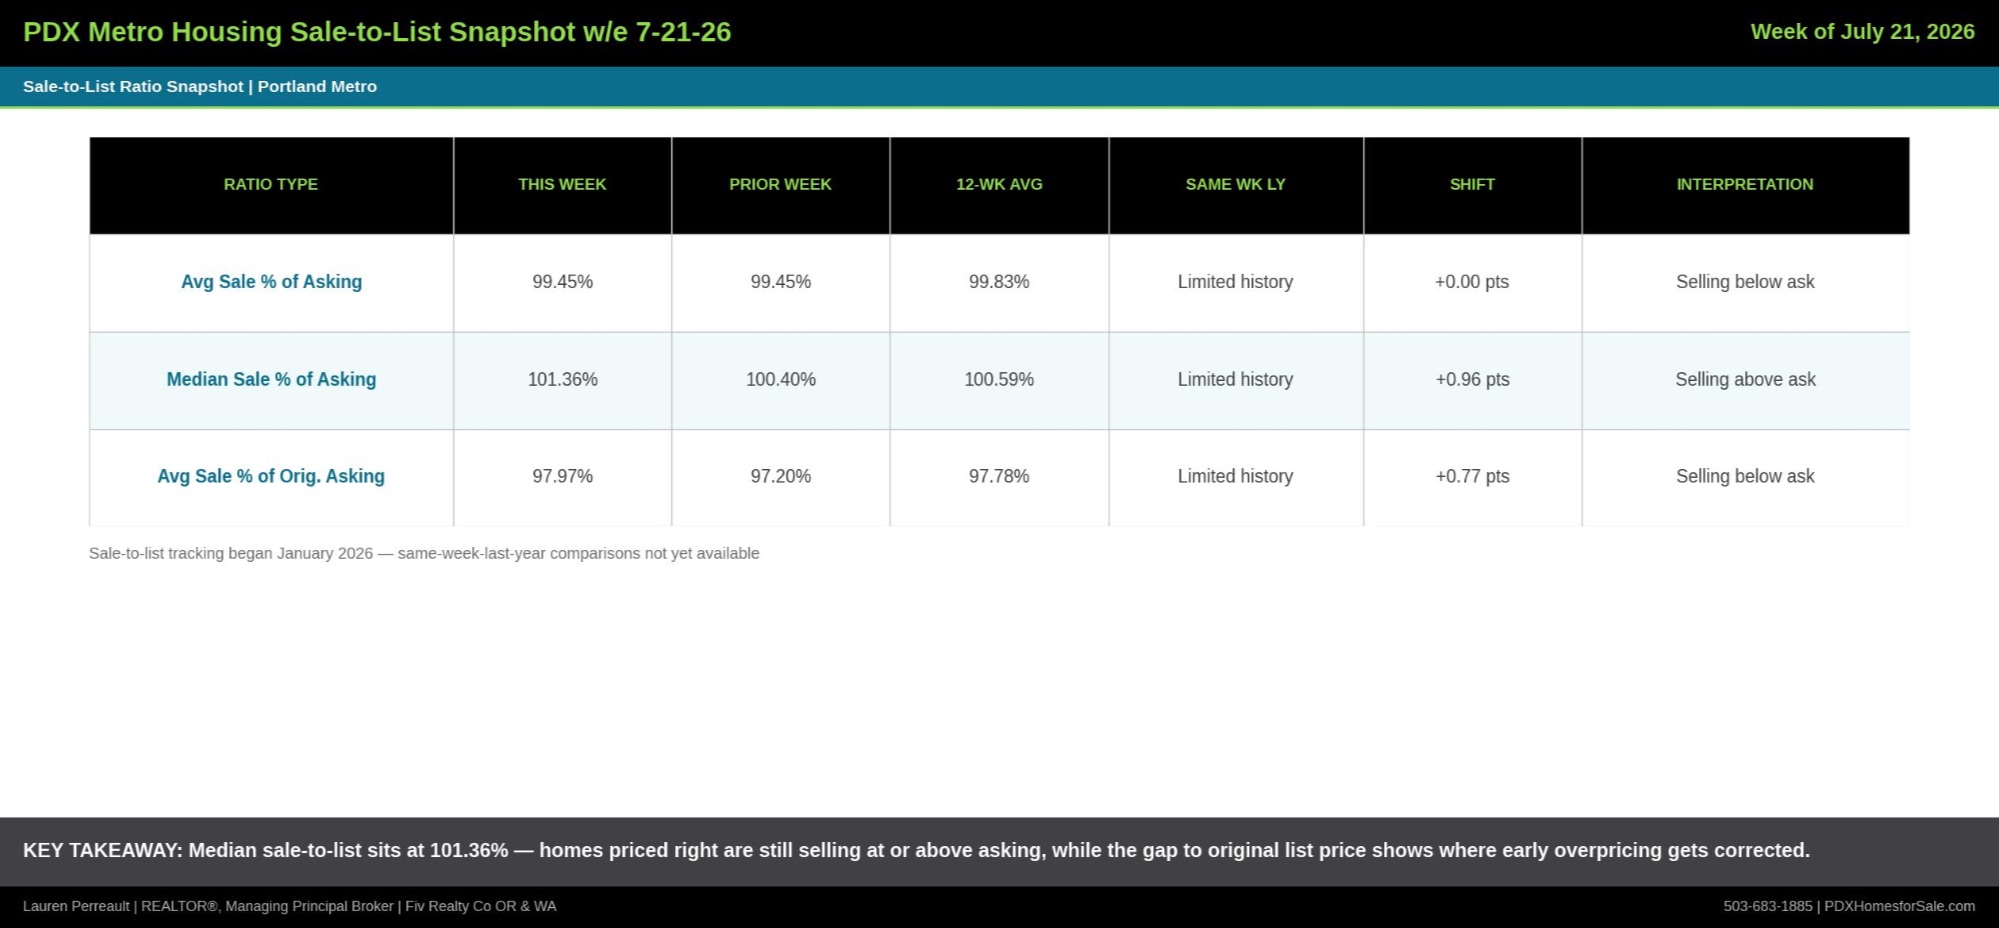
Sale-to-list ratios remain a bright spot for sellers who price correctly. Average sale price as a percentage of asking price came in at 99.45 percent this week, up slightly from 99.17 percent during the same week last year. Median sale price as a percentage of asking hit 101.36 percent, meaningfully ahead of last year's 99.57 percent, meaning more than half of homes that sold this week closed at or above their asking price.
Average sale price as a percentage of original asking price, which captures the full journey from initial list to final sale including any reductions along the way, came in at 97.97 percent, up from 96.60 percent a year ago. Since this metric only began tracking in January 2026, same-week-last-year comparisons for the 12-week rolling average are not yet available, but the trend so far points toward sellers losing less ground between original list and final sale price than they did last year.
Rates
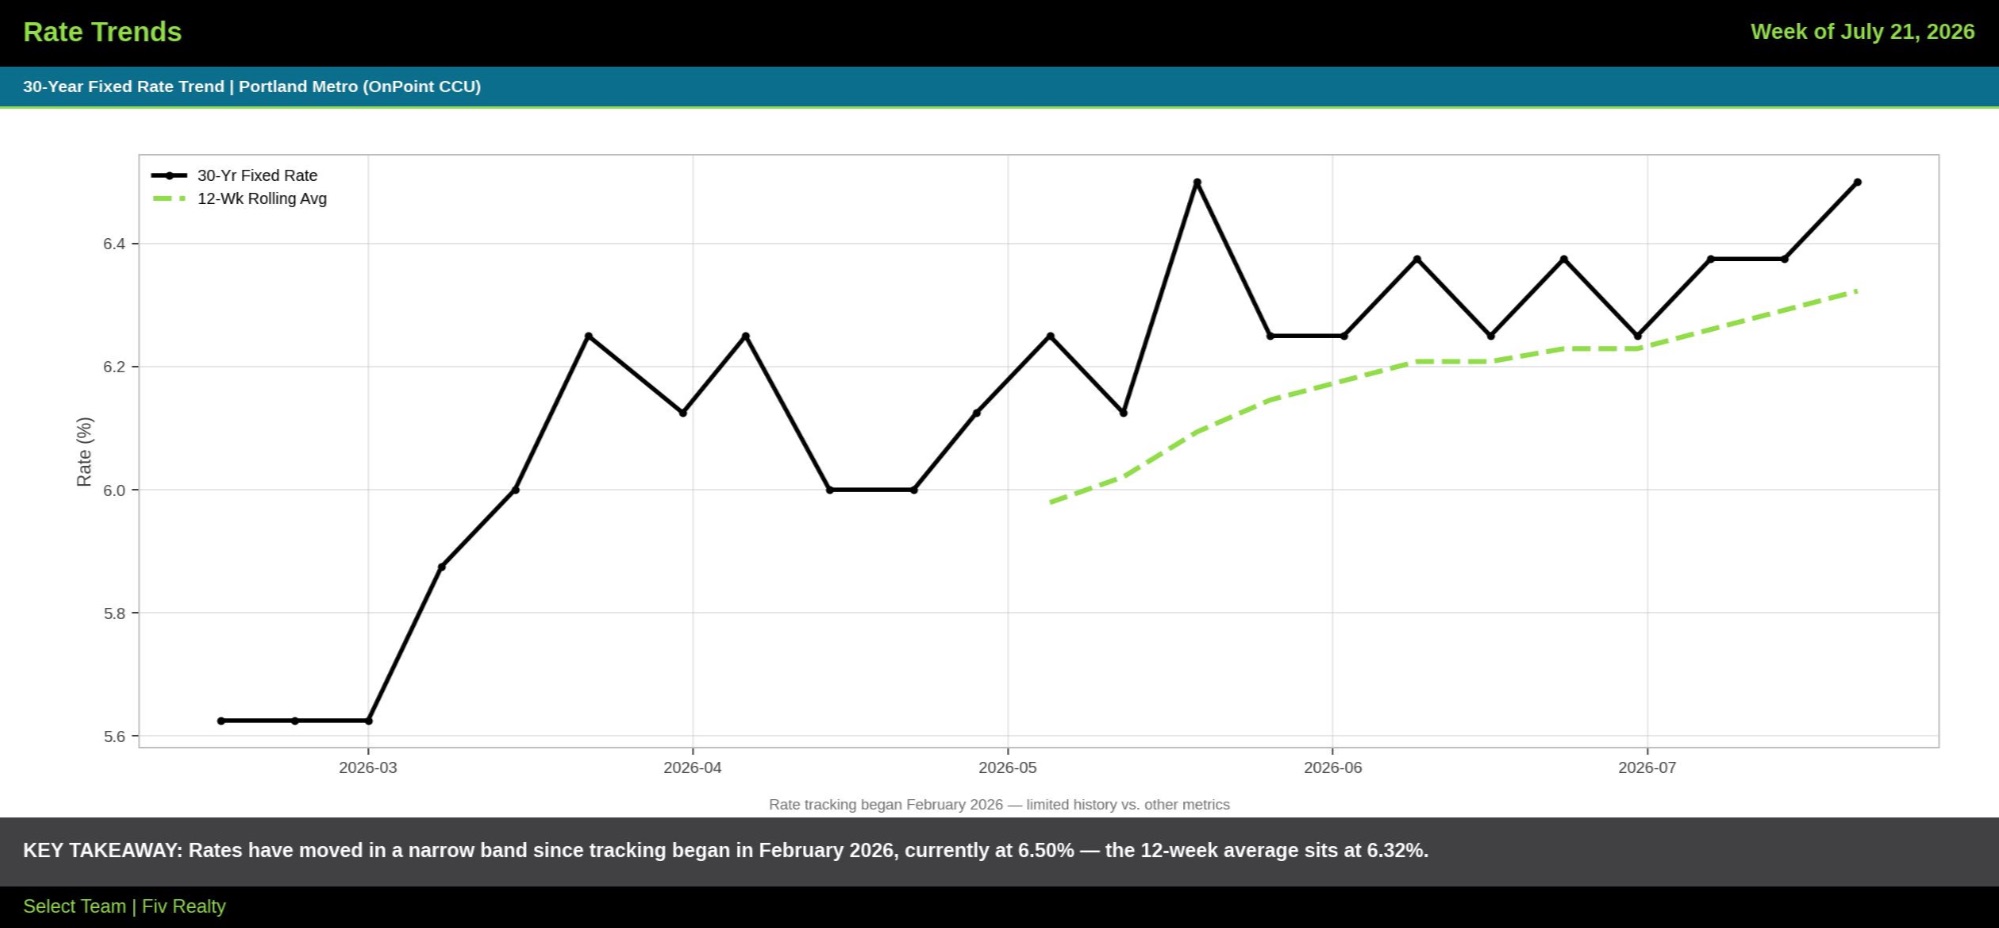
The 30-year fixed rate through OnPoint Community Credit Union moved up to 6.50 percent this week, from 6.375 percent the week before. Points held steady at 0.375, and APR ticked up to 6.594 percent from 6.468 percent. The 12-week rolling average for the rate now sits at 6.32 percent. Rate tracking for this series began in February 2026, so year-over-year comparisons are not yet available, but within the window we do have, rates have moved in a fairly narrow band between roughly 5.6 and 6.5 percent.
For buyers watching the rate environment closely, this week's move higher is worth noting, but it has not been enough to slow demand. Homes sold and new pending sales both moved up this week even as rates ticked higher, a reminder that motivated buyers are finding ways to make the numbers work.
Other Indicators
A few additional data points rounded out the week. Cancelled and expired listings continue their typical churn, a normal feature of any active market rather than a red flag on its own. REO and short sale activity remained a small share of overall inventory, both active and pending, consistent with recent weeks and still far from the levels seen during past downturns. None of these secondary indicators suggest anything unusual is brewing beneath the headline numbers.
My Read
Two things stand out to me this week. First, the two-speed market is as real as ever. If you are selling, the 31-day gap between average and median Days on Market is your clearest signal: price it right from day one, and you are still very likely to sell close to asking, if not above it. Median sale price as a percentage of asking sitting above 101 percent tells you buyers are willing and able to compete for the right listings. The homes dragging the average DOM upward almost always share a common trait: they were priced for a market that has already moved on.
Second, the drop in price reductions, especially on a 12-week rolling basis, tells me sellers have gotten smarter about initial pricing strategy compared to a year ago. That is a healthier market dynamic for everyone. Fewer reductions mean less whiplash for buyers watching a listing, and it means sellers are avoiding the stigma that can come from sitting too long before adjusting. A well-priced home that goes under contract quickly also tends to attract stronger, more confident offers than one that has cycled through multiple price cuts.
For buyers, this week's jump in new pending sales combined with a slight uptick in rates suggests a market where hesitation can cost you the home you want. If you have been waiting for a signal to get serious, strong demand paired with disciplined seller pricing is usually a sign that good opportunities do not sit around for long. The homes that are priced accurately and presented well are moving at a median pace of just 22 days, and in a market like this, that window can close faster than buyers expect.
The bigger picture across all these metrics is a market that is functioning in a healthy, sustainable way rather than swinging to extremes in either direction. Sellers who price thoughtfully are being rewarded. Buyers who move decisively on the right property are still finding success. That balance is exactly what makes strategy, rather than guesswork, the deciding factor in outcomes right now.
Let's Talk Strategy
Every market has its own personality, and the Portland Metro market right now rewards preparation over guesswork, whether you are buying, selling, or just trying to understand what your home is worth in today's conditions.
Call or text me if you want to truly understand what is happening in the Portland Metro real estate market and how various factors influence pricing. 503-683-1885 | PDXHomesforSale.com
Exceptional Strategy, Extraordinary Results.